INSPIRED BY WATER
NRWManager
NRWManager is a comprehensive, holistic, cloud-based data analysis, viewing and reporting system for management of NRW. Developed in-house and in use with our clients since 2010.
NRWManager integrates with all major data logging products, SCADA system data, customer billing system data and corporate GIS data to provide an automated, easy-to-use, system for viewing, analysing and reporting on all forms of water distribution data.
NRWManager is provided as SaaS (Software-as-a-Service) to deliver instant online access to water distribution data, anytime, anywhere and on any internet-connected device including, desktop PC, laptop PC, tablets and smartphones. Industry standard security protocols ensure your data security.


Holistic Integration
The NRWManager platform integrates
- Logged data from flow, pressure and level sensors in the water supply system
- GIS data
- SCADA data
- Customer billing data
This integration allows the automated calculation of monthly NRW volumes for each individual DMA, supply zone and supply system.
Multi-faceted
The system provides a wide-range of modules to provide the water loss control practitioner with single-system access to all the information needed to effectively and efficiently manage NRW.
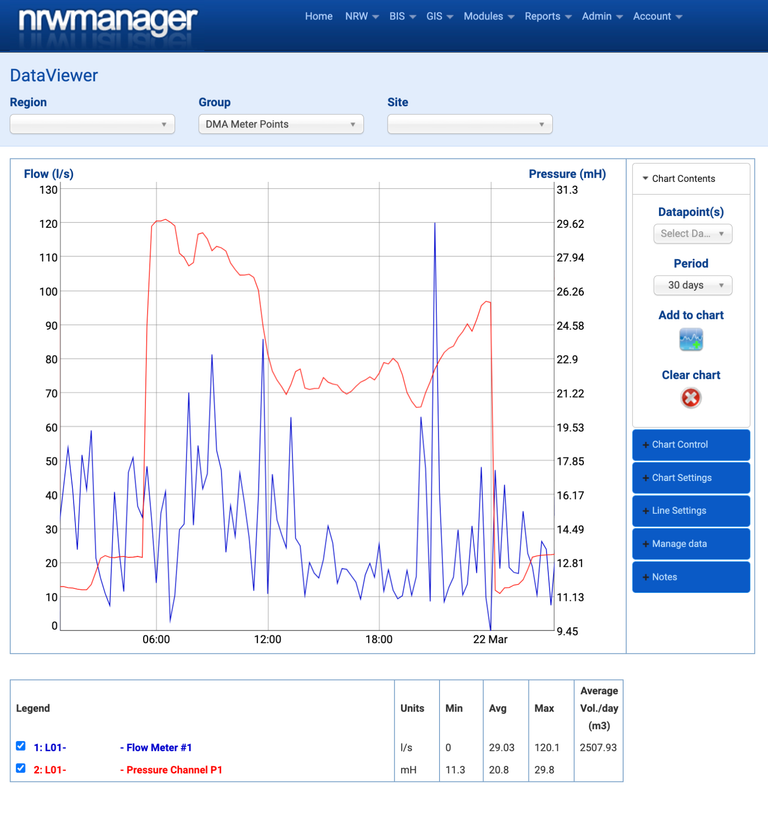
Intuitive Data Viewer
Integrate logged flow, pressure and water level data from any data source including data loggers, SCADA and manually collected data.
Our DataViewer is an intuitive, user friendly module that allows all network sensor data to be viewed in a single platform regardless of how the data was collected. View trends or drill down to specific events, Change line colours, units or export out to your preferred spreadsheet. Auto-scaling or fixed zero point. Fully user configurable.
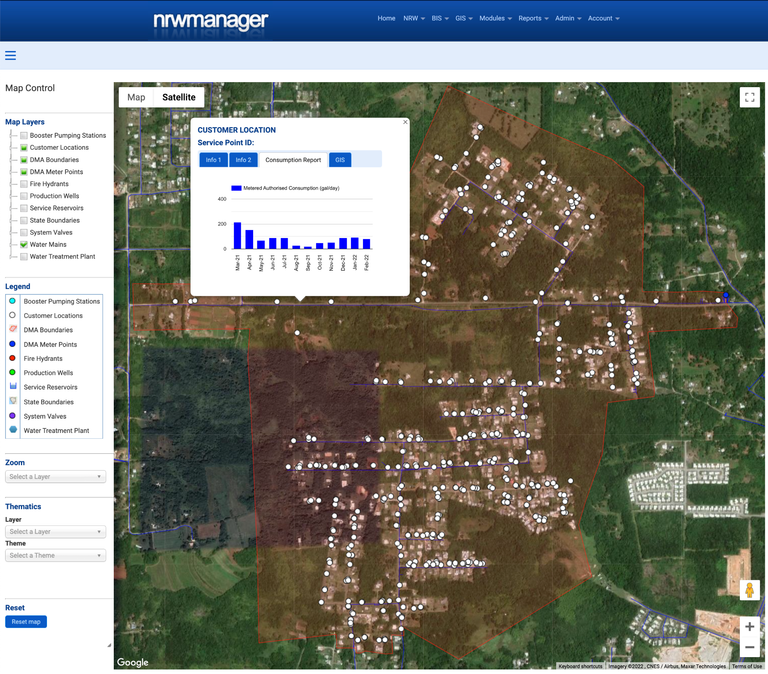
Desktop Mapping
View all your GIS infrastructure data against Google Maps background. Simple point-and-click tree-like layer control. Include logged data, customer consumption data, and detailed infrastructure in clickable, customisable, info-windows. Thematic mapping of assets by type, status, age and condition.
Rapid access to your GIS data without the hassle and expenses of installing bloated GIS software - no GIS experience needed.
Integrate customer locations, water mains, above-ground assets with data from your network sensors and customer meters.
See your system!
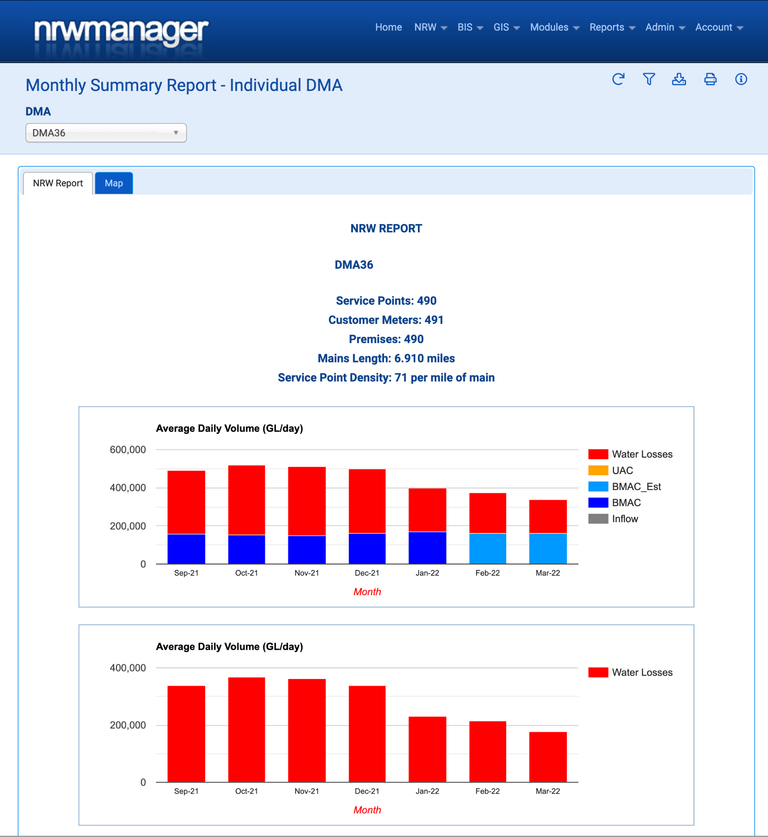
Automated NRW Reporting
Fully automated calculation and reporting of NRW volumes and KPIs for DMAs, water balance areas, water supply zones and whole system.
No more waiting for technicians to process data through spreadsheets. Always-on, 24/7 NRW reporting. Quickly identify problem areas and direct your water loss control teams to the areas that need the most attention.
Automated reporting for effective NRW management.
Reducing physical losses is all about time. The sooner you identify increasing water loss volumes, the faster you will tackle the problem, and the lower your overall NRW volumes will become.
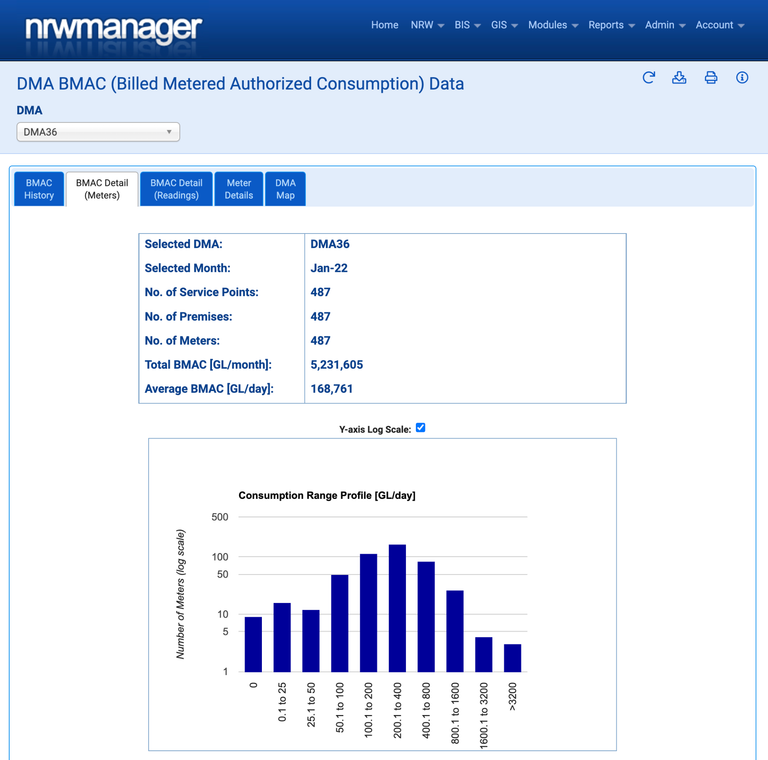
Customer Billing Data Analysis
Automated conversion of random-date customer meter readings into true calendar month Billed Metered Authorised Consumption volumes for collation to calendar month NRW reporting for DMAs, water supply systems or whole system.
Drill down to the detail and identify zero and low-consumption meters that have potential for revenue recovery. identify incorrectly sized meters where monthly consumption is too high or low for the in-service meter size.
Automated and manual correction of meter readings for meter reading errors and register malfunctions.
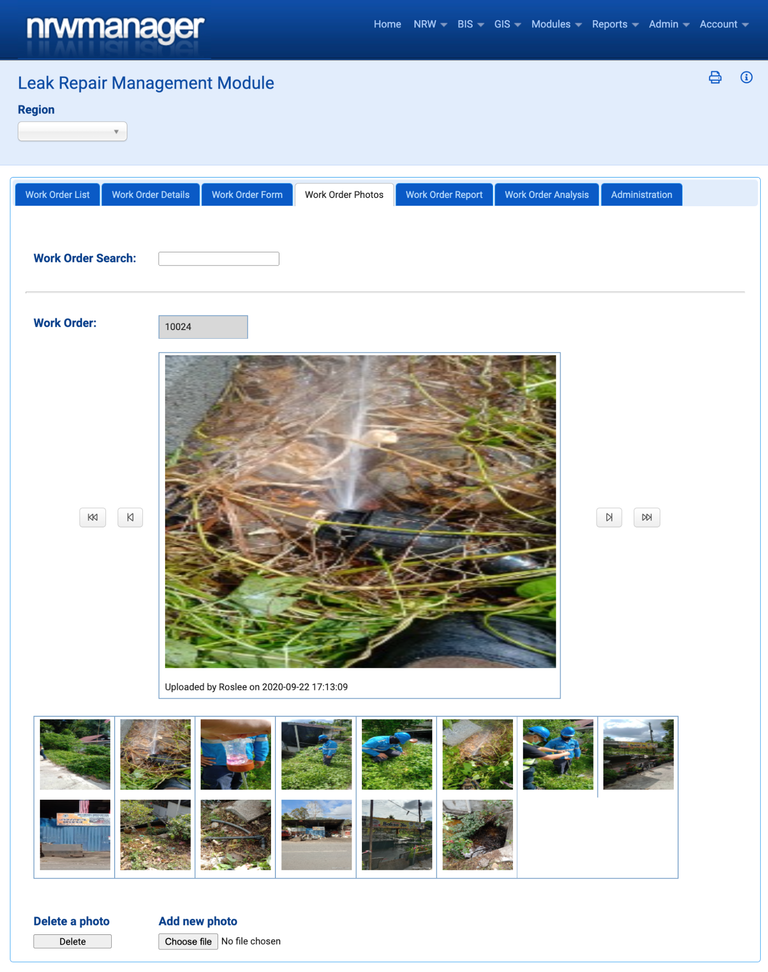
Leak Detection Campaign and Leak Repair Management
Manage your leak detection campaigns and monitor your water loss control team's performance.
Record detected leak details including photos. Produce standardised leak detection and repair reports. Analysis of detected leaks by pipe material, pipe size and location. Gain an understanding of what is causing your leak problem.
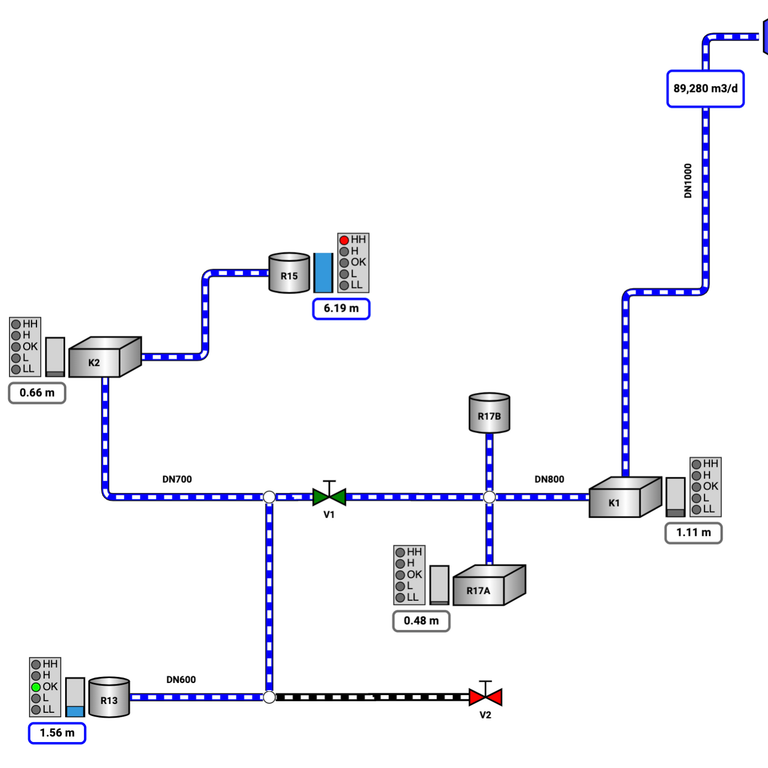
Interactive Dynamic Schematics
Leverage your logged data into interactive dynamic schematic diagrams to give a SCADA-like overview of your water supply and distribution system.
See your data in real-time with easy to read graphics for reservoir levels, system flows and pressures. Includes alarm panels for all key monitoring types.
Helps data users to readily visualise system dynamics with flow directions, reservoir levels, valve status and more.